The following graph shows the kinetics curves for the reaction of oxygen with hydrogen to form water: O2(g) + 2H2(g) 2H2O(g) . Which curve is hydrogen? 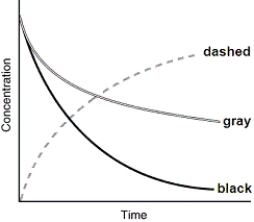
Definitions:
Per Capita
A statistical measure expressing a quantity per person, often used to compare the economic indicators of different places.
Family Income
The combined gross income of all members of a family living in the same household.
Average Height
The mean stature of individuals within a specific group or population, often used as a general indicator of nutritional and health status.
Life Course
A research perspective that studies individuals' lives within structural, social, and cultural contexts, focusing on changes and transitions across their lifespan.
Q3: The reaction A + 2B <font face="symbol"></font>
Q11: Consider the reaction of nitrogen and hydrogen
Q14: Carbon monoxide has a very weak dipole
Q27: In a spontaneous process, the entropy of
Q61: Indicate which one of the following reactions
Q74: The alpha form of polonium (Po) crystallizes
Q85: Which of the following is not typically
Q95: Which of the following illustrates the aldehyde
Q101: Which of the following are true regarding
Q110: Which d orbital(s) is/are highest in energy