In the following regression,which statement best describes the degree of multicollinearity? 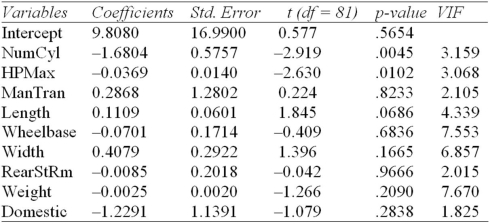
Definitions:
Correlation Analysis
A statistical method used to evaluate the strength and direction of the linear relationship between two quantitative variables.
Scatter Diagram
A graphical representation used to visualize the relationship between two quantitative variables.
Regression Line
A line plotted through the scatter plot of data points that best expresses the relationship between those points, typically used in linear regression.
Coefficient Of Correlation
A numerical measure that indicates the strength and direction of a linear relationship between two variables.
Q17: A taste test of randomly selected students
Q19: If SSR is 2592 and SSE is
Q36: Refer to the following MegaStat output (some
Q48: Given the following ANOVA table (some information
Q50: The total sum of squares (SST)will never
Q63: The Wilcoxon rank sum test (Mann-Whitney test)utilizes
Q76: Exponential trend allows growth but cannot be
Q90: Cochran's Rule requires observed frequencies of 5
Q105: Part of a regression output is provided
Q107: Autocorrelated errors are not usually a concern