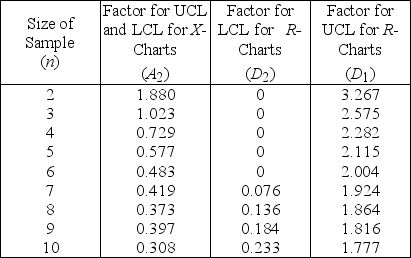
Table 6.1
Factors for Calculating Three-Sigma Limits for the  -chart and R-chart
 Source: 1950 Manual on Quality Control of Materials,copyright
American Society for Testing Materials.Reprinted with permission.
-A milling operation has historically produced an average thickness of 0.005 inch with an average range of 0.0015 inch.Currently,the first three items from each batch of 20 are inspected.Use Table 6.1.What is the value of LCL  if the sample size is increased to 6?
Definitions:
Instantaneous Risk-free Rate
The theoretical rate of return of an investment with no risk of financial loss, typically considered as a very short-term government bond yield.
Hedge Ratio
The ratio of the size of a position in a hedging instrument to the size of the position being hedged.
Strike Price
The price at which the holder of an option contract has the right to buy or sell the underlying asset.
Underlying Stock
The stock on which a derivative instrument, such as an option or future, is based.
Q15: The _ is the shortest time in
Q32: With a finite-source model,increasing the arrival rate
Q48: Continuous improvement is a philosophy that<br>A)waits until
Q48: Lowering inventory levels in a manufacturing process
Q77: Which of the following is NOT a
Q96: Which one of the following is part
Q132: Using Table 3.10,what is the probability of
Q146: The Franklin County Hospital is currently using
Q166: _ costs result from defects that are
Q196: Working with suppliers to increase the quality