In Figure 17-4, below, initial demand, marginal cost, and marginal revenue curves (none of them shown) caused the firm to produce the profit-maximizing quantity Y0 at a price of P0. Now the demand and marginal cost curves have moved to those shown, with the marginal revenue curve running through point L.
Figure 17-4 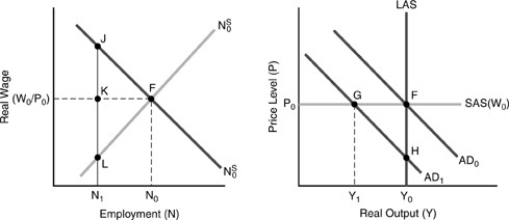
-In the figure above, the profit-maximizing quantity, in the absence of "menu costs," ________, with profit equal to ________.
Definitions:
Profit-Maximizing Output
The level of production that maximizes a firm’s profits, determined by the intersection of marginal cost and marginal revenue.
Total Revenue
The total income earned by a firm from selling its products or services, calculated as the quantity sold multiplied by the selling price.
Marginal Revenue
The additional income earned by selling one more unit of a product or service.
Minimum AVC
The lowest point on the Average Variable Cost curve, indicating the most efficient scale of production where variable costs per unit are minimized.
Q12: Which term represents a set of tasks
Q25: In the 1990s<br>A) growth of M1 was
Q28: Residential investment did not decline in the
Q45: Which of the following statements concerning the
Q59: Net investment becomes more unstable if j
Q84: The basic RBC model predicts _ movements
Q84: Between 1984 and 1989, the S&P 500
Q96: With a rise in the stock market,
Q131: Observers of the economy often complain that
Q166: In the fooling model's AD/SAS/LAS diagram, short-run