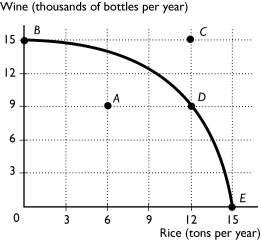
-The above figure shows the production possibility frontier for a country.What is the opportunity cost per ton of rice to move from point B to point D?
Definitions:
Substitutability
The degree to which one good or service can be replaced by another in consumption or production, often influencing competition and pricing in markets.
Elasticity of Supply
A measure of how much the quantity supplied of a good or service changes in response to a change in price.
Factor of Production
Inputs used in the production of goods or services, typically categorized into land, labor, capital, and entrepreneurship.
Cross Elasticity of Demand
The ratio of the percentage change in quantity demanded of one good to the percentage change in the price of some other good. A positive coefficient indicates the two products are substitute goods; a negative coefficient indicates they are complementary goods.
Q27: As a falling price eliminates a surplus
Q75: The figure above shows the production possibilities
Q79: If a nation devotes a larger share
Q93: Both the demand for and supply of
Q158: A country produces only apples and bananas.Moving
Q187: If an early frost destroys most of
Q194: One of the productive resources is capital.Capital
Q260: Which of the following increases the supply
Q286: What kind of information is conveyed in
Q290: In the above figure,an increase in productivity<br>A)