Multiple Choice
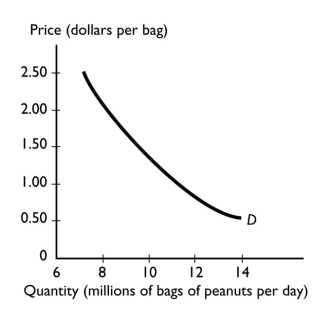
-The graph illustrates the demand for peanuts.Peanuts are a normal good because the
Definitions:
Related Questions
Q43: The price elasticity of demand for Red
Q52: A firm raises the price it charges.The
Q73: In the circular flow model,which of the
Q96: The price of a bag of pretzels
Q138: If two goods are _,then an increase
Q221: If the price elasticity of demand for
Q227: Why do nations engage in international trade?
Q236: In the above figure,_ will shift in
Q281: The figure above shows the production possibilities
Q324: Why does an increase in supply lead