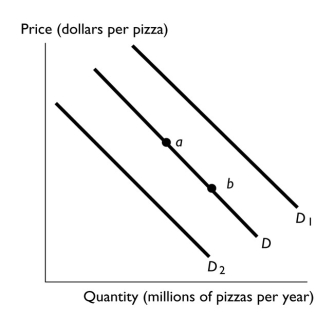
-In the above figure,the shift in the demand curve from D to D? can be the result of
Definitions:
Supply Curve
The supply curve is a graphical representation of the relationship between the price of a good or service and the quantity supplied by producers, typically sloping upwards indicating a higher quantity supplied at higher prices.
Demand Curve
A graphical representation showing the relationship between the quantity demanded of a good and its price.
Equilibrium Price
The cost at which consumer demand for a product matches the amount producers are willing to supply, resulting in a stable market.
Supply Curve
A graph showing the relationship between the price of a good and the quantity supplied, with price on the vertical axis and quantity on the horizontal axis.
Q52: The table above shows a nation's production
Q55: What is the effect on the price
Q78: The above figure shows the market for
Q79: If a nation devotes a larger share
Q157: If a firm supplies 200 units at
Q180: The bowed out (concave)shape of the production
Q230: If the income elasticity of demand for
Q237: A production point beyond the production possibilities
Q279: Goods that can be produced at a
Q328: For a good such as a large