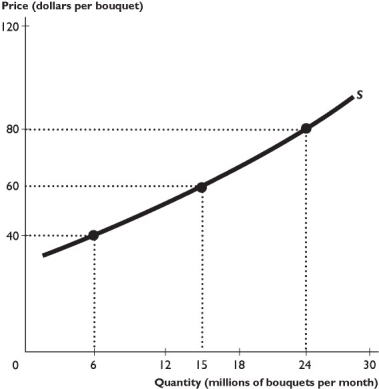
The figure above shows the supply curve for roses.
-In the figure above,at the point where the price is $60 per bunch,the price elasticity of supply is
Definitions:
Inventoriable Costs
Costs that are initially recorded as inventory on the balance sheet and recognized as cost of goods sold only when the inventory is sold.
Conversion Cost
The combined costs of direct labor and manufacturing overhead, representing the expenses to convert raw materials into finished goods.
Manufacturing Overhead
All manufacturing costs other than direct materials and direct labor, not directly traceable to specific units produced.
Direct Labor
Labor costs that are directly attributed to the production of goods or services, such as wages for assembly line workers.
Q70: When the demand for blue jeans increases,what
Q81: The above figures show the market for
Q83: What is consumer surplus?
Q84: During last year the price of regular
Q172: In the figure above,if pizza production is
Q184: Using the figure above,suppose Starbucks charges $4.50
Q197: In the figure above,the minimum price that
Q298: Explain the total revenue test.
Q301: Consider the market for turkeys.In the United
Q346: The producer surplus is found by subtracting