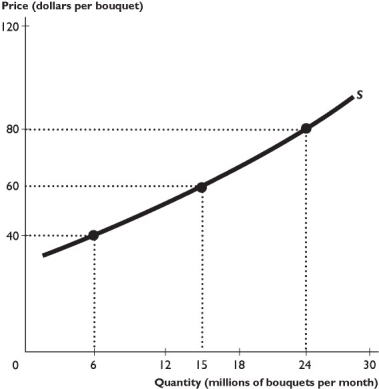
The figure above shows the supply curve for roses.
-Suppose a decrease in supply raises the price from $4.00 to $5.50 and decreases the quantity demanded from 2,000 to 1,500.Using the midpoint method,the elasticity of demand equals
Definitions:
Accumulated Depreciation
The total amount of depreciation expense that has been recorded against a fixed asset since it was acquired, representing the wear and tear over time.
Service Revenue
Income earned by a company for the services it provides to its clients.
Adjusting Entries
Journal entries made at the end of an accounting period to update certain accounts and report revenues and expenses in the appropriate period.
Depreciation Expense
An accounting method that allocates the cost of a tangible asset over its useful life.
Q10: List the factors that change demand and
Q21: In the figure above,the demand is unit
Q46: Suppose the current price of a pound
Q164: If a good is inferior,then it has
Q192: Products X,Y,and Z have price elasticities of
Q261: Marginal benefit equals the<br>A) benefit that a
Q262: Suppose Starbucks currently charges $2.50 per cup
Q282: Subsidies _ the price paid by the
Q304: Air pollution is an external cost because
Q312: Economists conclude that the only way to