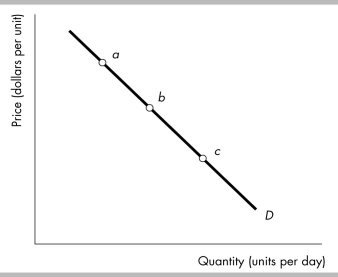
-In the figure above, at which point (a, b, or c) along the linear demand curve illustrated would demand be
a) most elastic?
b) most inelastic?
Definitions:
Market Price
The current price at which a good or service can be bought or sold in a marketplace.
Pesticides Cost
The economic expenses associated with the purchase and application of chemical substances used to kill or control pests that threaten agricultural production or health.
Market Supply Curve
A graphical representation showing the relationship between the price of a good and the total quantity supplied by all producers.
Production Technique
A method or process employed in the transformation of raw materials, components, or parts into finished goods ready for the market or subsequent processing.
Q13: In a housing market with a rent
Q103: The number of logging firms increases.Which of
Q142: How are the cross elasticity of demand
Q148: The figure above shows Kaley's marginal benefit
Q184: Explain the difference between a change in
Q197: When the price of a burrito increases
Q220: Suppose that the productivity used to produce
Q226: Seventy percent of Austin's chess club wanted
Q229: What is the effect on the price
Q287: If good weather conditions result in a