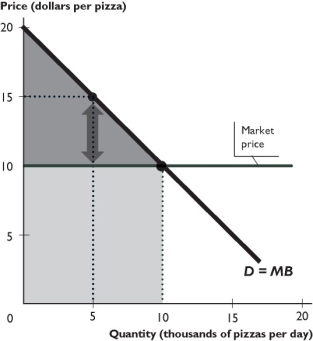
The figure above shows the demand curve for pizza and the market price of pizza.
-In the figure above,how much is the consumer who buys the 5,000th pizza willing to pay for that pizza?
Definitions:
Oligopoly Market Structure
A market form in which a market or industry is dominated by a small number of sellers (oligopolists).
Single Firm
A business entity that is the sole provider of a good or service in a particular market, potentially exhibiting monopoly power.
Large Number of Firms
A characteristic of competitive markets where many firms are present, each having a small share of the market and influencing the price minimally.
Defining Characteristics
The unique attributes or qualities that clearly distinguish a person, object, concept, or phenomenon from others within its category or domain.
Q34: Many manufactured goods have an _ supply
Q74: What is the "big tradeoff"?
Q116: If the price of a good decreases
Q131: The figure above shows the market for
Q176: The above figure shows the labor market
Q203: The graph shows the labor market for
Q204: A marginal benefit curve<br>A) is the same
Q288: To a seller,the cost of a good
Q314: the maximum price people are willing to
Q334: The figure above represents the competitive market