Short Answer
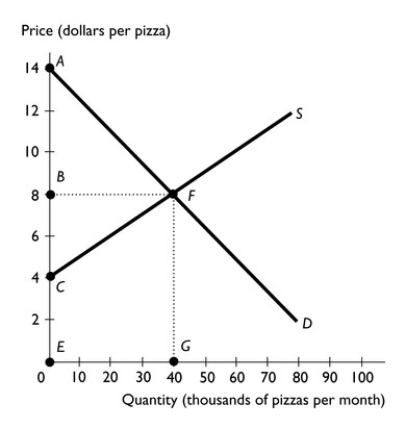
-The figure above shows the supply and demand curves for pizza.If the market is at its competitive equilibrium,what area in the graph above represents:
a.consumer surplus?
b.producer surplus?
Definitions:
Related Questions
Q74: Setting a price support in the market
Q79: The figure above shows the impact of
Q124: One result of a minimum wage is<br>A)
Q134: If a lower price for a Pepsi
Q137: A price floor makes prices<br>A) below the
Q165: A price ceiling is<br>A) a maximum legal
Q207: In the figure above,suppose that the government
Q235: If buyers pay more of a tax
Q270: Sales taxes are usually collected from sellers,who
Q274: Which of the following is true?<br>i.Marginal cost