Multiple Choice
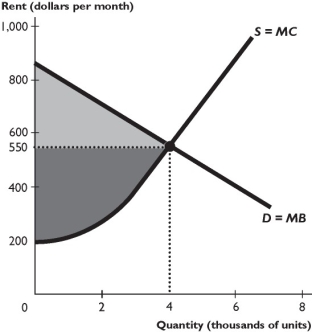
The figure above shows the supply and demand curves in the market for rental housing. A rent ceiling is set at $400 per month.
-As shown in the figure above,the rent ceiling ________ consumer surplus and ________ producer surplus.
Definitions:
Related Questions
Q52: The marriage tax problem in the United
Q74: Setting a price support in the market
Q90: If a rent ceiling is set below
Q112: The deadweight loss of a tax on
Q114: The above figure shows the U.S.market for
Q116: If a rent ceiling is imposed that
Q141: When a nation imports a good,its _
Q153: The graph shows the market for ski
Q190: In the above figure,if the market is
Q250: The imposition of a quota _ domestic