Refer to the information provided in Figure 12.1 below to answer the questions that follow. 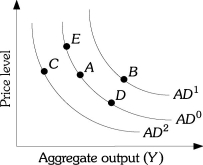 Figure 12.1
-Refer to Figure 12.1. Suppose the economy is at Point A. A(n) ________ can cause a movement to Point D.
Definitions:
Demand Curve
A graphical representation of the relationship between the price of a good and the quantity of that good that consumers are willing to purchase.
Product Supply Curve
A graphical representation showing the relationship between the price of a product and the quantity of the product that a supplier is willing and able to supply.
Production Technology
The methods, equipment, and processes used to produce goods or services, influencing efficiency and output quality.
Demand Curve
A graph depicting the relationship between the price of a good or service and the quantity demanded for a given period.
Q80: The following is likely to occur after
Q93: The economy is in a binding situation
Q98: The economic impact of _ during expansionary
Q103: If the long-run aggregate supply curve is
Q116: A movement up the aggregate supply curve
Q124: To decrease output the government could<br>A) adopt
Q125: _ acts as an automatic destabilizer because
Q141: A recognition lag is<br>A) the time it
Q153: According to the classical theory, an expansionary
Q186: A bond is a debt of the