Refer to the information provided in Figure 8.3 below to answer the questions that follow. 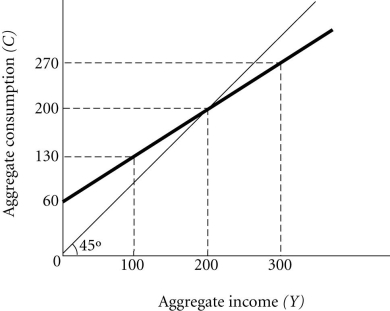 Figure 8.3
-Refer to Figure 8.3. If aggregate income is $1,000 billion, then in this society aggregate saving is ________ billion.
Definitions:
Fifth Year
Refers to the fifth year in a sequence or timeline, often used in the context of education, financial planning, or project timelines.
Probability
An assessment of the probability that a specific event will take place, usually represented by a value ranging from 0 to 1.
Tornado Chart
A tornado chart is a graphical method used to display the sensitivity of a system's outcome to changes in its input variables, resembling a tornado's shape when variables are displayed in descending order.
Sensitivity Chart
A sensitivity chart is a graphical representation used in decision making to show how different values of an independent variable affect a particular dependent variable.
Q29: Assuming there is no government or foreign
Q38: Refer to Figure 8.1. This household's consumption
Q89: Refer to Figure 8.1. [500 + 0.5Y]
Q130: Keynes used the phrase animal spirits to
Q161: Assume there is no government or foreign
Q163: As a percentage of government receipts, corporate
Q199: Refer to Figure 9.5. If the economy
Q265: The index used most often to measure
Q303: As the MPS decreases, the multiplier will<br>A)
Q312: If the tax multiplier is -5.25, then