Multiple Choice
Consider the graph shown below. 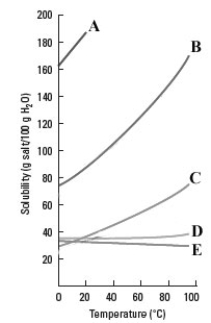 Which substance shows the smallest increase in solubility as the temperature is increased?
Definitions:
Related Questions
Q10: How many grams of Ba(OH)<sub>2</sub> are needed
Q10: Which of the following statements is/are correct?<br>(i)The
Q12: In the complete combustion of C<sub>3</sub>H<sub>8</sub>O<sub>3</sub>,how many
Q12: Which of the following is true of
Q13: Which of the following statements is true?<br>A)The
Q18: Which of the following is the best
Q19: Under Chapter 5, the individual debtor must
Q34: Consider the following graph. <img src="https://d2lvgg3v3hfg70.cloudfront.net/TB6511/.jpg" alt="Consider
Q36: What is the name of the location
Q40: The STP density of a gas is