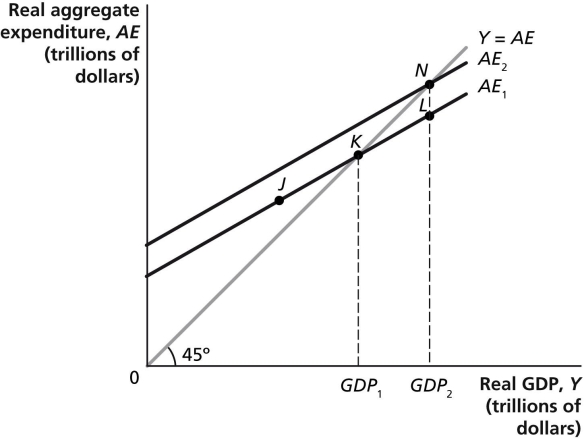
Figure 12-3 -Refer to Figure 12-3.Suppose That Government Spending Increases,shifting Up the Increases,shifting
Figure 12-3 
-Refer to Figure 12-3.Suppose that government spending increases,shifting up the aggregate expenditure line.GDP increases from GDP1 to GDP2,and this amount is $200 billion.If the MPC is 0.8,then what is the distance between N and L or by how much did government spending change?
Definitions:
Q7: Refer to Table 12-3.Given the consumption schedule
Q29: Refer to Table 12-1.Using the table above,compute
Q45: Refer to Figure 13-1.Ceteris paribus,a decrease in
Q52: All of the following are assumptions made
Q97: Refer to Figure 10-1.Which of the following
Q191: Technological improvements are more likely to occur
Q205: Ceteris paribus,how does an expansion in the
Q210: The economic growth model predicts that<br>A)GDP per
Q222: At macroeconomic equilibrium,total _ equals total _.<br>A)spending;production<br>B)investment;inventories<br>C)consumption;production<br>D)taxes;transfers
Q225: If national income increases by $20 million