Figure 4-1 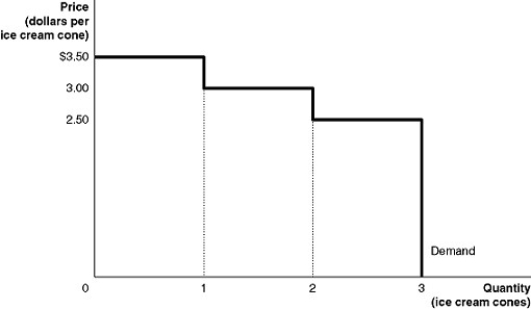 Figure 4-1 shows Kendra's demand curve for ice cream cones.
-Refer to Figure 4-1.If the market price is $3.50,what is the maximum number of ice cream cones that Kendra will buy?
Definitions:
Day Treatment Centers
Mental health facilities that allow people to obtain treatment, along with occupational and rehabilitative therapies, during the day but to live at home at night.
Occupational Therapies
Therapies aimed at enabling people to participate in the activities of everyday life by improving their ability to perform tasks in their daily living and work environments.
Rehabilitative Therapies
Therapeutic interventions aimed at improving, maintaining, or restoring physical abilities and quality of life.
Deinstitutionalization
The policy or process of releasing individuals from psychiatric hospitals or similar facilities to care for them in community-based settings.
Q46: Refer to Figure 5-1.The efficient equilibrium price
Q49: Which of the following statements is true?<br>A)A
Q53: In the market for gasoline,an increase in
Q54: Which of the following is not an
Q57: _ tended to increase spending on health
Q65: The health care system in _ is
Q79: Adverse selection will occur in a market
Q111: Adverse selection refers to the actions people
Q231: Aimee sells hand-embroidered dog apparel over the
Q243: A sole proprietorship is limited to how