Figure 3-8 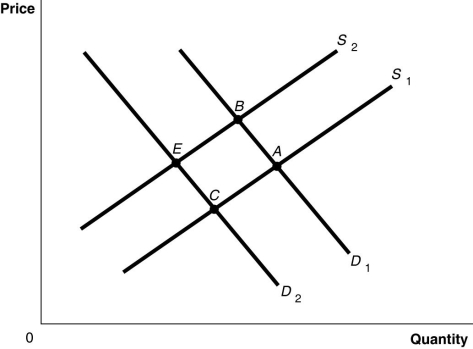
-Refer to Figure 3-8.The graph in this figure illustrates an initial competitive equilibrium in the market for motorcycles at the intersection of D2 and S1 (point C) .Which of the following changes would cause the equilibrium to change to point B?
Definitions:
Price of a Resource
The monetary value assigned to a raw material, energy, or other fundamental inputs used in the production of goods and services.
Substitute Inputs
Alternatives that can be used in the production process if the original inputs become too expensive or unavailable.
Consumers
Individuals or groups who use goods and services to satisfy their personal needs and desires.
Unskilled Labor
Workforce with no special training or qualifications, often associated with manual or simple tasks.
Q31: Refer to Figure 4-4.The figure above represents
Q42: Refer to Figure 2-4.A movement from _
Q74: Because new plastic and recycled plastic are
Q81: Refer to Figure 5-1.Marginal private benefit is
Q84: A supply curve<br>A)is a table that shows
Q88: What causes a production possibilities frontier to
Q102: The government makes all economic decisions in
Q118: Refer to the Article Summary.If the 12
Q136: Refer to Table 2-5.If the two countries
Q155: Refer to Figure 2-3.Carlos Vanya grows tomatoes