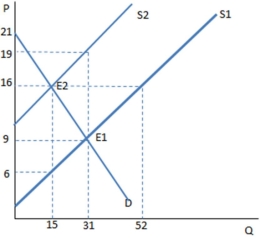
 The graph shown demonstrates a tax on sellers. Once the tax has been imposed, the sellers produce ____ units and receive _____ for each one sold.
Definitions:
Subsystems Integration
The process of making different subcomponents of a system work together effectively and efficiently for overall system performance.
Liaison Roles
Positions or functions within an organization tasked with facilitating communication and coordination between different departments or groups.
Hierarchical Referral
The process of escalating issues or decisions up the chain of command within an organization according to its hierarchy.
Network Structures
Refers to the arrangement and interconnection of nodes in a physical or logical network.
Q19: When growth goes down, unemployment tends to
Q39: The government office that declares official periods
Q54: <img src="https://d2lvgg3v3hfg70.cloudfront.net/TB6625/.jpg" alt=" The graph shown
Q64: A price ceiling is:<br>A) a legal maximum
Q72: Assume there are three hardware stores, each
Q100: <img src="https://d2lvgg3v3hfg70.cloudfront.net/TB6625/.jpg" alt=" Using the information
Q100: When the prevailing market wage is above
Q116: <img src="https://d2lvgg3v3hfg70.cloudfront.net/TB6625/.jpg" alt=" According to the
Q139: <img src="https://d2lvgg3v3hfg70.cloudfront.net/TB6625/.jpg" alt=" The graph shown
Q144: Transaction costs can be defined as the