Quarterly sales of a department store for the last seven years are given in the following table. 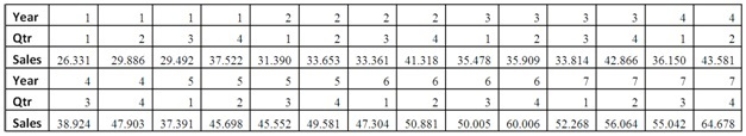
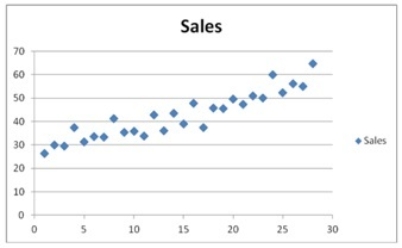 The Excel scatterplot shown indicates that the quarterly sales have an increasing trend and seasonality.Therefore,the linear regression model,Sales = β0 + β1Qtr1 + β2Qtr2 + β3Qtr3 + β4t + ε,with three seasonal dummy variables Qtr1,Qtr2,and Qtr3,and the decomposition method are proposed to make sales forecasts.For the regression model,the following Excel partial output is available.
 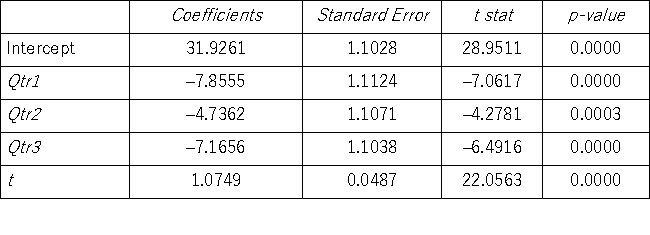 Using the regression equation for the linear trend model with seasonal dummy variables,what is the sales forecast for the fourth quarter of Year 8?
Definitions:
Control Premium
The additional amount willing to be paid over the fair market value of a company's shares, reflecting the value of obtaining control of the company.
Partial Goodwill Method
An accounting technique used in business combinations where goodwill is only recognized for the owners' share in the acquired party, not the non-controlling interest (NCI).
Ownership Interest
A stake or share in a company or property, representing the holder's right to its assets and profits.
Q13: Investment institutions usually have funds with different
Q17: If two linear regression models have the
Q40: Consider the following regression model, Humidity =
Q45: It is believed that the sales volume
Q65: The past monthly demands are shown below.The
Q68: The coefficient of determination R<sup>2</sup> is _.<br>A)
Q69: Three firms,X,Y,and Z,operate in the same industry,although
Q96: A researcher analyzes the factors that may
Q113: Consider the following sample data.: <img src="https://d2lvgg3v3hfg70.cloudfront.net/TB4266/.jpg"
Q136: A manager at a ski resort in