The following table shows the annual revenues (in millions of dollars)of a pharmaceutical company over the period 1990-2011.  The autoregressive models of order 1 and 2,yt = β0 + β1yt - 1 + εt,and yt = β0 + β1yt - 1 + β2yt - 2 + εt,were applied on the time series to make revenue forecasts.The relevant parts of Excel regression outputs are given below.
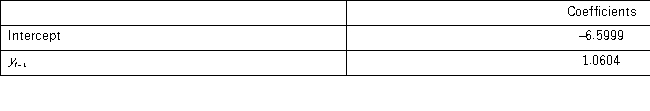
Model AR(1): 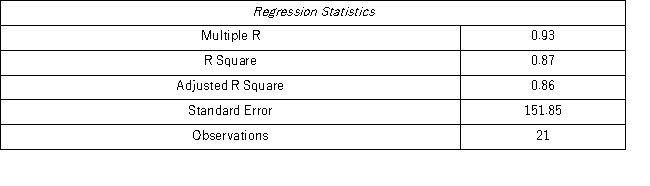
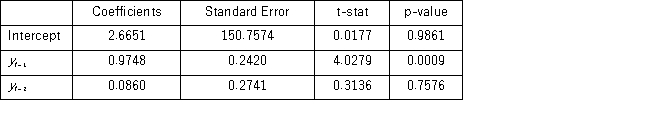
 Model AR(2):
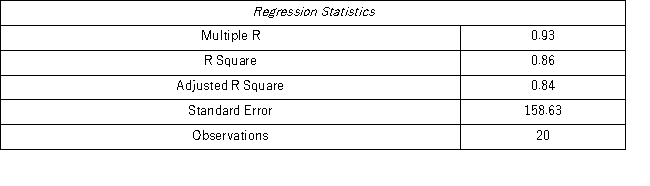
 Using the AR(1)model,find the company revenue forecast for 2012.
Definitions:
Q2: According to the Center for Disease Control
Q10: The log-log regression model is _ in
Q15: A study was conducted to determine if
Q24: The following ratio-to-moving averages for the seasonally
Q29: An index number is an easy-to-interpret numerical
Q35: An economic model:<br>A) should include all possible
Q47: The linear and logarithmic models,y = β<sub>0</sub>
Q58: Which of the following is the correct
Q80: A trading magazine wants to know if
Q116: Suppose the simple price index for a