Quarterly sales of a department store for the last seven years are given in the following table. 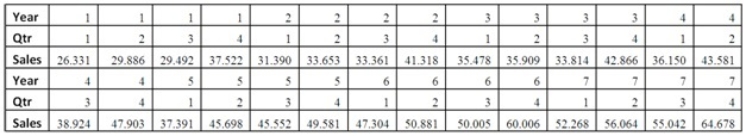
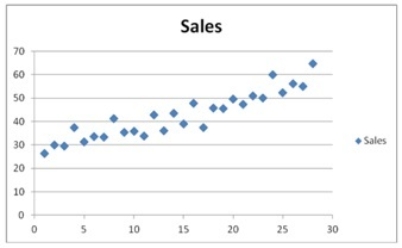 The Excel scatterplot shown indicates that the quarterly sales have an increasing trend and seasonality.Therefore,the linear regression model,Sales = β0 + β1Qtr1 + β2Qtr2 + β3Qtr3 + β4t + ε,with three seasonal dummy variables Qtr1,Qtr2,and Qtr3,and the decomposition method are proposed to make sales forecasts.For the regression model,the following Excel partial output is available.
 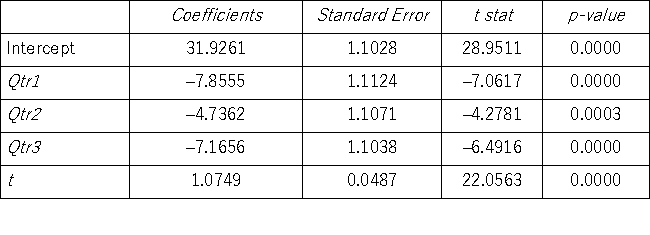 Using the regression equation for the linear trend model with seasonal dummy variables,what can be said about the sales in Quarter 4 compared to the sales in Quarter 1?
Definitions:
Potential Objections
Anticipated arguments or concerns that might be raised against a proposal, idea, or argument.
Marketing Messages
Communications aimed at informing, persuading, or reminding consumers about a product, service, or brand.
Fact Sheet
A concise presentation of key facts, figures, and points about a specific topic, often used in public relations and marketing.
Desire Phase
In marketing, the stage where a consumer develops a favorable inclination towards a product or service, following awareness and interest.
Q2: A shipping company believes there is a
Q37: Which of the following is the relationship
Q44: If out of the two cities that
Q76: Tom and Jerry have two tasks to
Q84: Jake Morris invested $150 in buying a
Q86: The concepts of comparative advantage, specialization, and
Q96: A realtor wants to predict and compare
Q105: To examine the differences between salaries of
Q111: A bank manager is interested in assigning
Q116: A simple linear regression of the return