The following Excel scatterplot with the fitted quadratic regression equation illustrates the observed relationship between productivity and the number of hired workers. 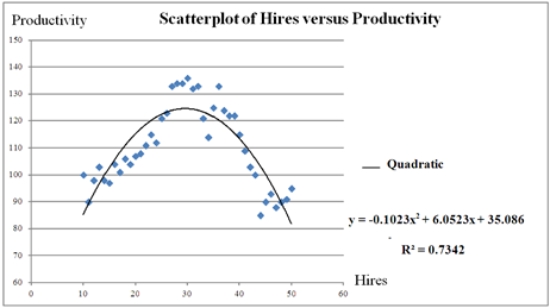 For which value of Hires is the predicted Productivity maximized? Note: Do not round to the nearest integer.
Definitions:
Bank Services
Refers to the various services and products offered by banks to their customers, such as checking accounts, loans, and financial advice.
Internal Control
Processes and procedures implemented by a company to safeguard its assets, enhance the reliability of its accounting records, and ensure compliance with laws and regulations.
Banking Activities
Operations carried out by banks, including deposits, loans, investments, and currency exchange.
Petty Cash Fund
A small amount of cash on hand that is used for covering minor expenses in a business.
Q2: When using Fisher's least difference (LSD)method at
Q9: In a simple linear regression based on
Q23: The actual value y may differ from
Q37: The following Excel scatterplot with the fitted
Q48: If in the multiple linear model the
Q61: A regression equation was estimated as <img
Q65: The past monthly demands are shown below.The
Q71: The following table shows the distribution of
Q82: A fund manager wants to know if
Q114: Regression models that use a binary variable