The following data show the demand for an airline ticket dependent on the price of this ticket. 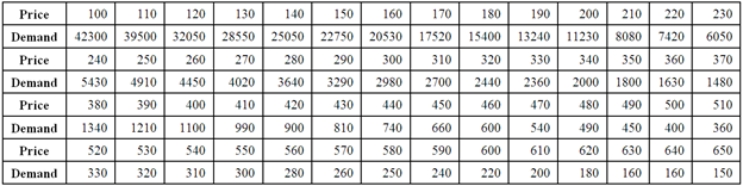 For the assumed cubic and log-log regression models,Demand = β0 + β1Price + β2Price2 + β3Price3 + ε and ln(Demand) = β0 + β1ln(Price) + ε,the following regression results are available.
 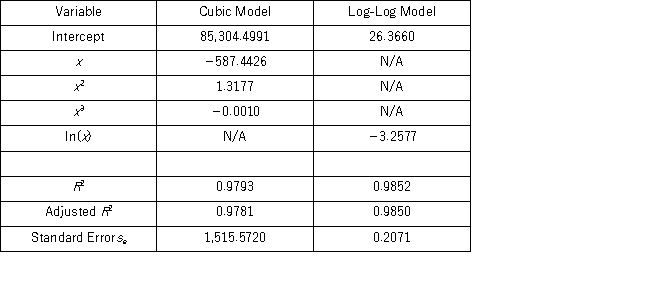 Assuming that the sample correlation coefficient between Demand and
  = exp(26.3660 - 3.2577 ln(Price) + (0.2071) 2/2) is 0.956,what is the predicted demand for a price of $250 found by the model with better fit?
Definitions:
Variability
The extent to which data points differ from each other and from the mean of the data set.
Sampling Distribution
The distribution that indicates the probabilities of a given statistic, which is acquired from a random sample.
T-distribution
A probability distribution used in statistics that arises when estimating the mean of a normally distributed population in situations where the sample size is small and the population standard deviation is unknown.
Standard Normal Distribution
Normal distribution measured in standard deviation units with a mean equal to 0 and a standard deviation equal to 1.
Q7: The value of the test statistic for
Q7: Consider the partially completed two-way ANOVA (with
Q12: In a two-way ANOVA test,how many null
Q40: The following table shows the annual revenues
Q41: For the chi-square test for normality,the expected
Q49: Toyota Motor Corp. ,once considered a company
Q78: Consider the following information about the price
Q84: The F distribution depends on _ degrees
Q85: For the quadratic equation <img src="https://d2lvgg3v3hfg70.cloudfront.net/TB4266/.jpg" alt="For
Q107: A sociologist wishes to study the relationship