It is believed that the sales volume of one-liter Pepsi bottles depends on the price of the bottle and the price of a one-liter bottle of Coca-Cola.The following data have been collected for a certain sales region. 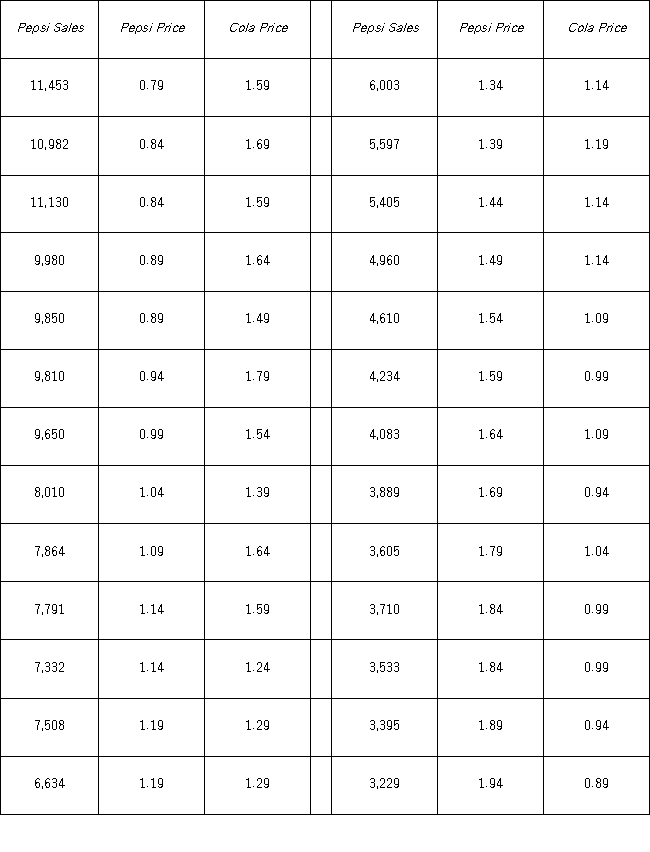 Using Excel's regression,the linear model Pepsi Sales = β0 + β1Pepsi Price + β2Cola Price + ε and the log-log model ln(Pepsi Sales)= β0 + β1 ln(Pepsi Price)+ β2 ln(Cola Price)+ ε have been estimated as follows:
 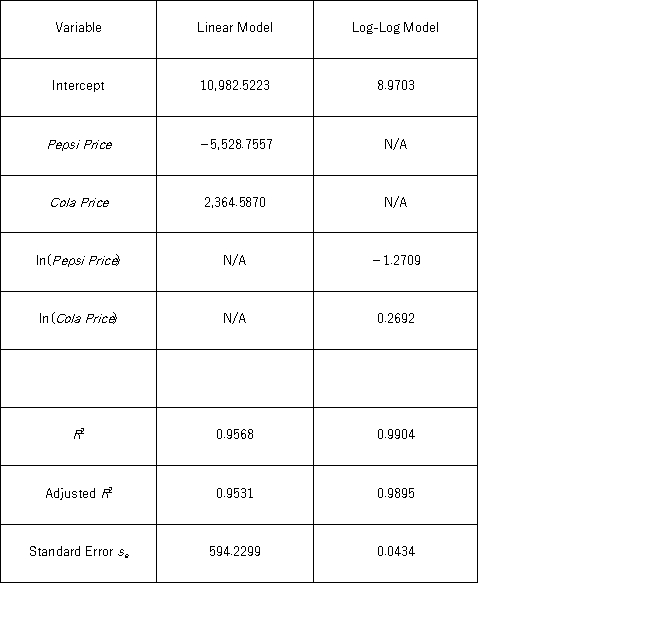 For the estimated linear model,when the Cola Price is held constant what is the predicted change in the Pepsi Salesif the Pepsi Price increases by 10 cents?
Definitions:
Simple Linear Regression
A statistical method for modeling the relationship between a single independent variable and a dependent variable by fitting a linear equation to observed data.
Linear Regression
A statistical method for modeling the relationship between one dependent variable and one or more independent variables using a linear equation.
Population Parameters
Numerical characteristics that describe certain aspects of a population.
Y-intercept
The value of the dependent variable in a linear equation when the independent variable is zero, representing the point of intersection with the y-axis on a graph.
Q2: When using Fisher's least difference (LSD)method at
Q4: A sociologist wishes to study the relationship
Q36: The following data,with the corresponding Excel scatterplot,show
Q44: The alternative hypothesis for the test of
Q50: For the quadratic regression equation <img src="https://d2lvgg3v3hfg70.cloudfront.net/TB4266/.jpg"
Q67: In the following table,individuals are cross-classified by
Q69: The following table includes the information about
Q98: Tiffany & Co.has been the world's premier
Q99: The following table shows the distribution of
Q103: Which of the following predictions cannot be