It is believed that the sales volume of one-liter Pepsi bottles depends on the price of the bottle and the price of a one-liter bottle of Coca-Cola.The following data have been collected for a certain sales region. 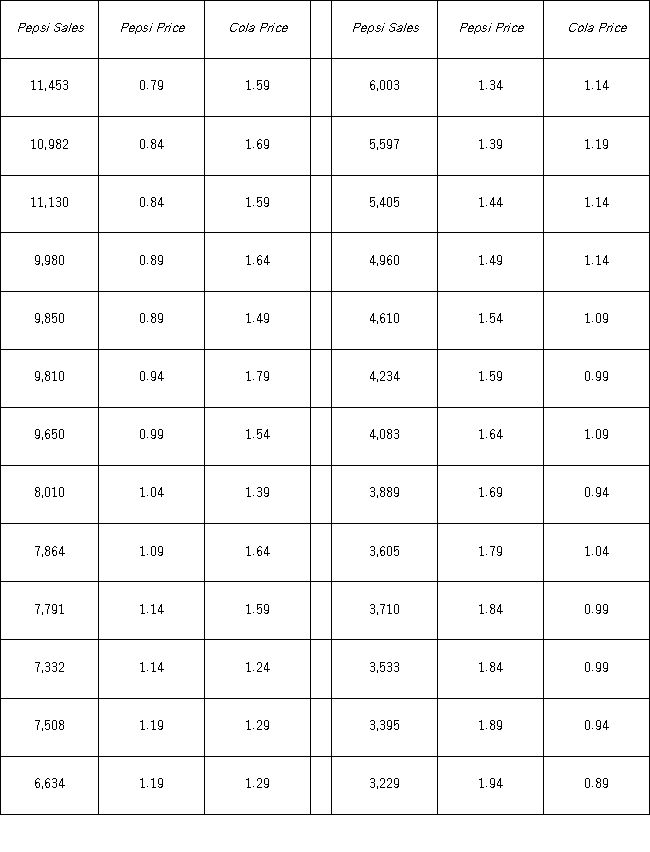 Using Excel's regression,the linear model Pepsi Sales = β0 + β1Pepsi Price + β2Cola Price + ε and the log-log model ln(Pepsi Sales)= β0 + β1ln(Pepsi Price)+ β2ln(Cola Price)+ ε have been estimated as follows:
 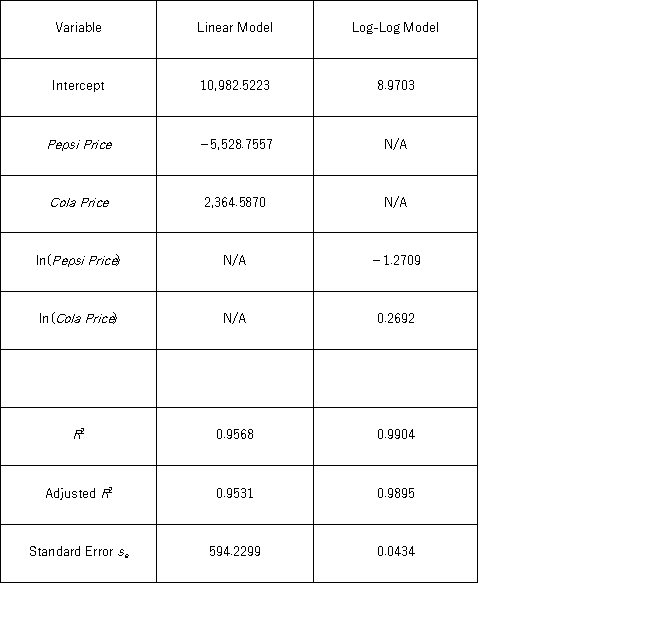 (Use Excel)What is the percentage of variations in the Pepsi Sales as explained by the estimated log-log model?
Definitions:
Variance
A measure of the dispersion or spread of a set of data points around their mean; it quantifies the degree to which these points differ from the mean.
Original Data
The initial dataset collected or received before any processing, manipulation, or analysis has been done.
Independent Events
Events whose occurrence or outcome is not influenced by the occurrence or outcome of another event.
P(A and B)
The probability that both events A and B occur.
Q3: Thirty employed single individuals were randomly selected
Q18: The regression y<sub>t</sub> = β<sub>0</sub> + β<sub>1</sub>y<sub>t</sub><sub>-1</sub>
Q35: The log-log and exponential models,ln(x)= β<sub>0</sub> +
Q38: Which of the following is a correct
Q53: Becky owns a diner and is concerned
Q74: Quantitative variables assume meaningful _,where as qualitative
Q83: Joanna Williams purchased a one-year Treasury bill
Q85: Using the decomposition model y<sub>t</sub> = T<sub>t</sub>
Q87: A research analyst believes that a positive
Q102: A researcher gathers data on 25 households