The scatterplot shown below represents a typical shape of a cubic regression model y = β0 + β1x + β2x2 + β3x3 + ε. 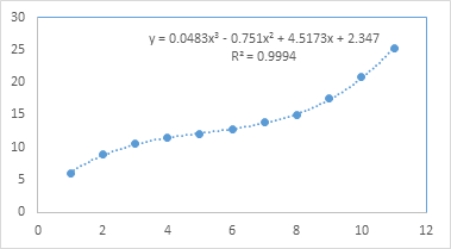 Which of the following is true about values of the regression coefficients?
Definitions:
Nominal Scale
A measurement scale used for categorizing variables without a quantitative value or order.
Pie Graph
A visual representation of data that divides a circle into slices to illustrate numerical proportions.
Frequency Distribution
A table or graph that displays how often different values or categories occur in a dataset.
Histogram
A histogram is a graphical representation that organizes a group of data points into user-specified ranges, showing the frequency of data values within those ranges.
Q2: A manager at a local bank analyzed
Q7: Lindsay Kelly bought 100 shares of Google,300
Q16: When estimating <img src="https://d2lvgg3v3hfg70.cloudfront.net/TB4266/.jpg" alt="When estimating
Q28: A researcher analyzes the factors that may
Q36: When estimating a multiple regression model,the following
Q42: Unlike the coefficient of determination,the coefficient of
Q43: SHY (NYSEARCA: SHY)is a 1−3 year Treasury
Q78: Calculate the value of R<sup>2 </sup>given the
Q83: In a multiple regression based on 30
Q87: Thirty employed single individuals were randomly selected