Multiple Choice
The scatterplot shown below represents a typical shape of a cubic regression model y = β0 + β1x + β2x2 + β3x3 + ε. 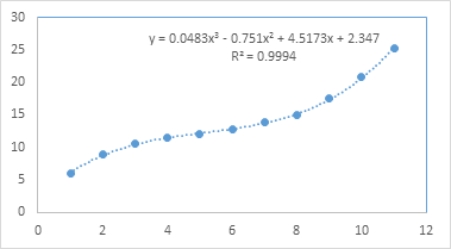 Which of the following is a predicted value
  if x is equal to 12?
Definitions:
Related Questions
Q11: A wine magazine wants to know if
Q21: When two factors interact,the effect of one
Q29: When using Fisher's LSD method at some
Q32: The fit of the models y =
Q32: The following data for five years of
Q34: The aggregate price index is used to
Q65: A wine magazine wants to know if
Q73: Typically,the sales volume declines with an increase
Q82: The _ equation is a theoretical relationship
Q94: The following Excel scatterplot with the fitted