The following frequency distribution shows the monthly stock returns for Home Depot for the years 2003 through 2007. 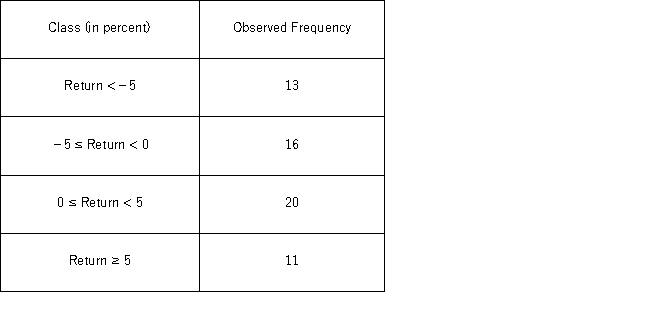 Over the time period,the following summary statistics are provided: Mean = 0.31%,Standard deviation = 6.49%,Skewness = 0.15,and Kurtosis = 0.38.The test statistic for the Jarque-Bera test for normality is ______.
Definitions:
Aggregate Consumption
Aggregate consumption is the total amount of goods and services consumed in an economy, reflecting overall consumer spending.
Consumption Function
An economic formula representing the functional relationship between total consumption and gross national income.
Aggregate Income
The total income earned by all individuals and entities within an economy.
Aggregate Consumption
The total amount of goods and services consumed in an economy within a given period.
Q12: What are the degrees of freedom for
Q12: Edmunds.com would like to test the hypothesis
Q31: Which of the following is the correct
Q40: Consider the partially completed two-way ANOVA (without
Q50: Which of the following is a correct
Q55: If there are five treatments under study,the
Q57: Which of the following is the 95%
Q76: Like the z distribution,the t<sub>df</sub> distribution is
Q117: Confidence intervals of the population mean may
Q131: A company has developed a new diet