The following table displays the top 40 American League batting averages of the 2011 season. 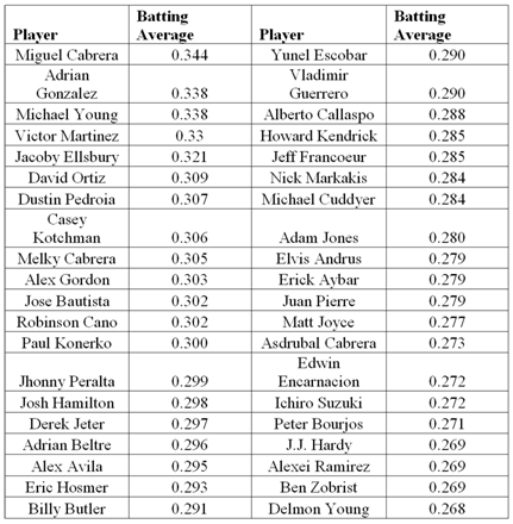 a.Construct frequency,relative frequency,and cumulative relative frequency distributions that group the data in classes of 0.265 up to 0.280,0.280 up to 0.295,0.295 up to 0.310,and so on.
b.How many of these players have a batting average above 0.340? What proportion of these players has a batting average of at least 0.280 but below 0.295? What percentage of these players has a batting average below 0.325?
c.Construct a relative frequency histogram.Is the distribution symmetric? If not,is it positively or negatively skewed?
d.Construct an ogive.
e.Using the ogive,approximately what proportion of the players in this group has a batting average above 0.290?
Definitions:
Identity Foreclosure
The status of adolescents who prematurely commit to an identity without adequately exploring alternatives.
Moratorium
The status of adolescents who may have explored various identity alternatives to some degree but have not yet committed themselves.
Identity Diffusion
The status of adolescents who consider various identity alternatives but never commit to one or never even consider identity options in any conscious way.
Identity Foreclosure
A stage in Erikson's theory of identity development where an individual commits to an identity without exploring other options.
Q2: Discuss the three common styles of leadership
Q19: Informational listening skills are especially useful for
Q22: A bowler's scores for a sample of
Q23: Those with the most power in a
Q29: What can college students do to bridge
Q32: The idea that one's self-image is shaped
Q43: Consider a population with data values of
Q87: Which of the following is a quantitative
Q94: Administrators have concluded that the SAT exam
Q127: Thirty percent of the CFA candidates have