You have decided to analyze the year-to-year variation in temperature data.Specifically you want to use this year's temperature to predict next year's temperature for certain cities.As a result,you collect the daily high temperature (Temp)for 100 randomly selected days in a given year for three United States cities: Boston,Chicago,and Los Angeles.You then repeat the exercise for the following year.The regression results are as follows (heteroskedasticity-robust standard errors in parentheses):  = 18.19 + 0.75 ×
  ;R2 = 0.62,SER = 12.33
(6.46)(0.10)  = 2.47 + 0.95 ×
  ;R2 = 0.93,SER = 5.85
(3.98)(0.05)  = 37.54 + 0.44 ×
  ;R2 = 0.18,SER = 7.17
(15.33)(0.22)
(a)What is the prediction of the above regression for Los Angeles if the temperature in the previous year was 75 degrees? What would be the prediction for Boston?
(b)Assume that the previous year's temperature gives accurate predictions,on average,for this year's temperature.What values would you expect in this case for the intercept and slope? Sketch how each of the above regressions behaves compared to this line.
(c)After reflecting on the results a bit,you consider the following explanation for the above results.Daily high temperatures on any given date are measured with error in the following sense: for any given day in any of the three cities,say January 28,there is a true underlying seasonal temperature (X),but each year there are different temporary weather patterns (v,w)which result in a temperature  different from X.For the two years in your data set,the situation can be described as follows:
  = X + vt and
  = X + wt
Subtracting  from
from  ,you get
  =
=  + wt - vt.Hence the population parameter for the intercept and slope are zero and one,as expected.Show that the OLS estimator for the slope is inconsistent,where
 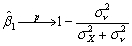 (d)Use the formula above to explain the differences in the results for the three cities.Is your mathematical explanation intuitively plausible?
Definitions:
Socioeconomic Status
A social standing or class of an individual or group often measured by education, income, and occupation.
Longevity
The length of time an individual lives, often used in the context of life span extension and quality of life.
Functional Age
Measure of a person’s ability to function effectively in his or her physical and social environment in comparison with others of the same chronological age.
Geriatrics
The branch of medicine focusing on the health, care, and diseases of older adults and the challenges associated with aging.
Q11: You have collected data for 104 countries
Q12: Barings Bank failed due to excessive government
Q16: To test whether or not the population
Q16: In an FRA on an m-day rate,payment
Q25: An example of the interaction term between
Q26: Lower transaction costs are one advantage of
Q29: The binary variable interaction regression<br>A)can only be
Q46: How many puts should be used to
Q52: Looking at formula (7.13)in your textbook for
Q56: The following are all least squares assumptions