Several authors have tried to measure the "persistence" in U.S state unemployment rates by running the following regression: 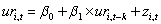 where ur is the state unemployment rate,i is the index for the i-th state,t indicates a time period,and typically k ≥ 10.
(a)Explain why finding a slope estimate of one and an intercept of zero is typically interpreted as evidence of "persistence."
(b)You collect data on the 48 contiguous U.S.states' unemployment rates and find the following estimates:  = 2.25 + 0.60 ×
  ;R2 = 0.40,SER = 0.90
(0.61)(0.13)
Interpret the regression results.
(c)Analyzing the accompanying figure,and interpret the observation for Maryland and for Washington.Do you find evidence of persistence? How would you test for it? 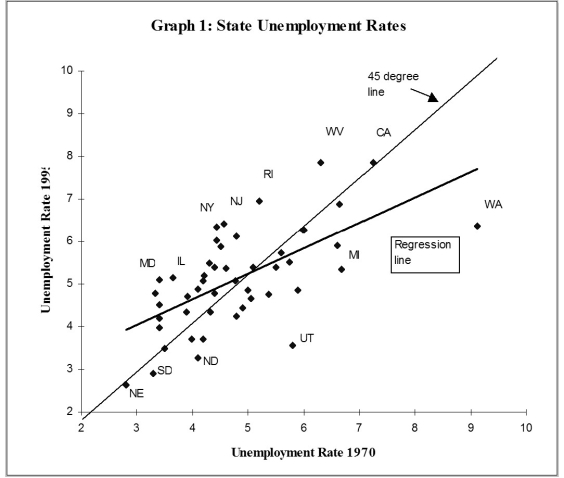 (d)One of your peers points out that this result makes little sense,since it implies that eventually all states would have identical unemployment rates.Explain the argument.
(e)Imagine that state unemployment rates were determined by their natural rates and some transitory shock.The natural rates themselves may be functions of the unemployment insurance benefits of the state,unionization rates of its labor force,demographics,sectoral composition,etc.The transitory components may include state-specific shocks to its terms of trade such as raw material movements and demand shocks from the other states.You specify the i-th state unemployment rate accordingly as follows for the two periods when you observe it, 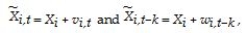 so that actual unemployment rates are measured with error.You have also assumed that the natural rate is the same for both periods.Subtracting the second period from the first then results in the following population regression function:
 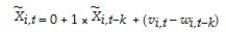 It is not too hard to show that estimation of the observed unemployment rate in period t on the unemployment rate in period (t-k)by OLS results in an estimator for the slope coefficient that is biased towards zero.The formula is
 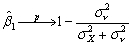 .
.
Using this insight,explain over which periods you would expect the slope to be closer to one,and over which period it should be closer to zero.
(f)Estimating the same regression for a different time period results in  = 3.19 + 0.27 ×
  ;R2 = 0.21,SER = 1.03
(0.56)(0.07)
If your above analysis is correct,what are the implications for this time period?
Definitions:
Finished Goods Inventory
Products that have completed the manufacturing process and are ready to be sold to customers.
Weighted Average Cost
A method of calculating the cost of goods sold and ending inventory cost by taking into account the cost of goods purchased at varying prices.
Beginning Inventory
The value of a company's inventory at the start of an accounting period, used in calculating cost of goods sold.
Cost Of Goods Sold
The direct costs attributable to the production of the goods sold by a company, including material, labor, and overhead costs.
Q1: Barrier options either begin or end when
Q4: The baseball team nearest to your home
Q8: Options on futures are also known as<br>A)spot
Q34: A call option gives the holder<br>A)the right
Q36: Dealers typically have more sophisticated risk management
Q37: The OLS slope estimator is not defined
Q39: Finding a small value of the p-value
Q41: Operational risk is more difficult to manage
Q49: Asian options provide the right to give
Q62: Show that the correlation coefficient between Y