You have been asked by your younger sister to help her with a science fair project.During the previous years she already studied why objects float and there also was the inevitable volcano project.Having learned regression techniques recently,you suggest that she investigate the weight-height relationship of 4th to 6th graders.Her presentation topic will be to explain how people at carnivals predict weight.You collect data for roughly 100 boys and girls between the ages of nine and twelve and estimate for her the following relationship:  = 45.59 + 4.32 × Height4,R2 = 0.55,SER = 15.69
(3.81)(0.46)
where Weight is in pounds,and Height4 is inches above 4 feet.
(a)Interpret the results.
(b)You remember from the medical literature that females in the adult population are,on average,shorter than males and weigh less.You also seem to have heard that females,controlling for height,are supposed to weigh less than males.To see if this relationship holds for children,you add a binary variable (DFY)that takes on the value one for girls and is zero otherwise.You estimate the following regression function:  = 36.27 + 17.33 × DFY + 5.32 × Height4 - 1.83 × (DFY × Height4),
(5.99)(7.36)(0.80)(0.90)
R2 = 0.58,SER = 15.41
Are the signs on the new coefficients as expected? Are the new coefficients individually statistically significant? Write down and sketch the regression function for boys and girls separately.
(c)The medical literature provides you with the following information for median height and weight of nine- to twelve-year-olds:
Median Height and Weight for Children,Age 9-12
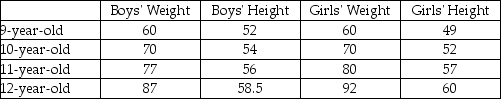 Insert two height/weight measures each for boys and girls and see how accurate your predictions are.
(d)The F-statistic for testing that the intercept and slope for boys and girls are identical is 2.92.Find the critical values at the 5% and 1% level,and make a decision.Allowing for a different intercept with an identical slope results in a t-statistic for DFY of (-0.35).Having identical intercepts but different slopes gives a t-statistic on (DFYHeight4)of (-0.35)also.Does this affect your previous conclusion?
(e)Assume that you also wanted to test if the relationship changes by age.Briefly outline how you would specify the regression including the gender binary variable and an age binary variable (Older)that takes on a value of one for eleven to twelve year olds and is zero otherwise.Indicate in a table of two rows and two columns how the estimated relationship would vary between younger girls,older girls,younger boys,and older boys.
Definitions:
AI System
Artificial Intelligence System: Computer systems designed to mimic human intelligence, performing tasks such as recognizing speech, making decisions, and translating languages.
Spoken Words
Oral expressions or utterances used in communication; can also refer to live or recorded verbal presentations or performances.
Register Terminals
Electronic devices used in retail settings to process transactions, manage sales, and interact with customers.
Consumer Buying Patterns
The study of how individual consumers or groups purchase, use, and dispose of goods and services over time.
Q3: Which of the following is not a
Q5: Which of the following methods is not
Q6: Suppose you buy an asset at $50
Q10: Attendance at sports events depends on various
Q14: You have collected a sub-sample from the
Q15: Set up the null hypothesis and alternative
Q16: When the estimated slope coefficient in the
Q27: Looking at a large CPS data set
Q55: Swaps are created in the over-the-counter market.
Q60: The upside capture measure is always less