You have collected quarterly Canadian data on the unemployment and the inflation rate from 1962:I to 2001:IV.You want to re-estimate the ADL(3,1)formulation of the Phillips curve using a GARCH(1,1)specification.The results are as follows:  t = 1.17 - .56 ΔInft-1 - .47 ΔInft-2 - .31 ΔInft-3 - .13 Unempt-1
(.48)(.08)(.10)(.09)(.06)  = .86 + .27
  + .53
+ .53  .
.
(.40)(.11)(.15)
(a)Test the two coefficients for  and
and  in the GARCH model individually for statistical significance.
(b)Estimating the same equation by OLS results in  t = 1.19 - .51 ΔInft-1 - .47 ΔInft-2 - .28 ΔInft-3 - .16Unempt-1
(.54)(.10)(.11)(.08)(.07)
Briefly compare the estimates.Which of the two methods do you prefer?
(c)Given your results from the test in (a),what can you say about the variance of the error terms in the Phillips Curve for Canada?
(d)The following figure plots the residuals along with bands of plus or minus one predicted standard deviation (that is,±  )based on the GARCH(1,1)model.
 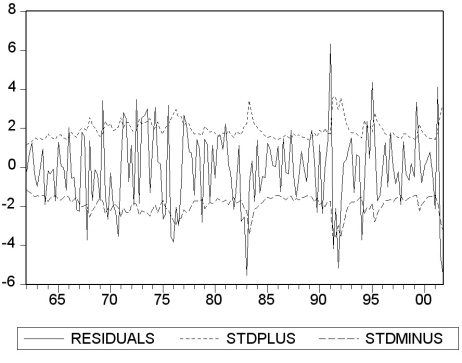 Describe what you see.
Definitions:
Arrow Keys
Keys on a keyboard used to move the cursor or navigate around a digital environment in specified directions.
Mouse Keys
Mouse Keys is an accessibility feature that allows a user to control the mouse pointer using the numeric keypad on a keyboard.
Region Dialog Box
A user interface element that allows users to modify settings for a specific area or application feature.
Date And Time
Representations of specific moments measured in days, months, years, hours, minutes, and/or seconds.
Q2: The forecast is<br>A)made for some date beyond
Q3: (Requires Appendix material)The following are examples of
Q17: The OLS estimator is derived by<br>A)connecting the
Q33: In the simple linear regression model,the regression
Q43: Interpreting the intercept in a sample regression
Q50: In time series,the definition of causal effects<br>A)says
Q52: Your textbook extends the simple regression analysis
Q60: The OLS residuals, <img src="https://d2lvgg3v3hfg70.cloudfront.net/TB2833/.jpg" alt="The OLS
Q63: Use the definition for the conditional distribution
Q94: A review of voter registration records in