You collect monthly data on the money supply (M2)for the United States from 1962:1-2002:4 to forecast future money supply behavior. 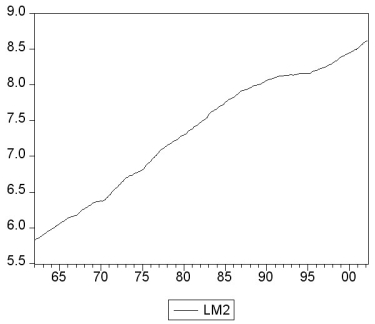
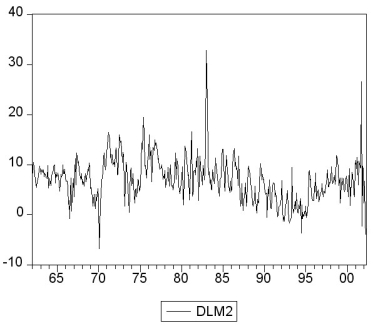 where LM2 and DLM2 are the log level and growth rate of M2.
(a)Using quarterly data,when analyzing inflation and unemployment in the United States,the textbook converted log levels of variables into growth rates by differencing the log levels,and then multiplying these by 400.Given that you have monthly data,how would you proceed here?
(b)How would you go about testing for a stochastic trend in LM2 and DLM2? Be specific about how to decide the number of lags to be included and whether or not to include a deterministic trend in your test.The textbook found the (quarterly)inflation rate to have a unit root.Does this have any affect on your expectation about whether or not the (monthly)money growth rate should be stationary?
(c)You decide to conduct an ADF unit root test for LM2,DLM2,and the change in the growth rate ΔDLM2.This results in the following t-statistic on the parameter of interest.
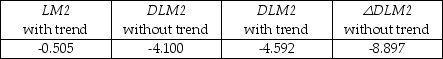 Find the critical value at the 1%,5%,and 10% level and decide which of the coefficients is significant.What is the alternative hypothesis?
(d)In forecasting the money growth rate,you add lags of the monetary base growth rate (DLMB)to see if you can improve on the forecasting performance of a chosen AR(10)model in DLM2.You perform a Granger causality test on the 9 lags of DLMB and find a F-statistic of 2.31.Discuss the implications.
(e)Curious about the result in the previous question,you decide to estimate an ADL(10,10)for DLMB and calculate the F-statistic for the Granger causality test on the 9 lag coefficients of DLM2.This turns out to be 0.66.Discuss.
(f)Is there any a priori reason for you to be skeptical of the results? What other tests should you perform?
Definitions:
Negative Cash Balance
A situation where a company or individual's cash account balance drops below zero, indicating that the account is overdrawn.
Current Liability
Short-term financial obligations that are due within one year or within a normal operating cycle.
Bank Indebtedness
The amount of debt owed to banks by an individual or corporation, typically arising from loans or overdrafts.
Payroll Liabilities
Financial obligations related to employee compensation, including owed wages, salaries, and other benefits, which a company must pay.
Q1: Use a standard spreadsheet program,such as Excel,to
Q4: HAC standard errors and clustered standard errors
Q21: <img src="https://d2lvgg3v3hfg70.cloudfront.net/TB2833/.jpg" alt=" A)
Q24: You collect monthly data on the money
Q26: Because statistical software plays such an important
Q31: Having more relevant instruments<br>A)is a problem because
Q41: The AIC is a statistic<br>A)that is used
Q44: Equation (11.3)in your textbook presents the regression
Q46: "I am an applied econometrician and therefore
Q97: Suppose you are conducting a study to