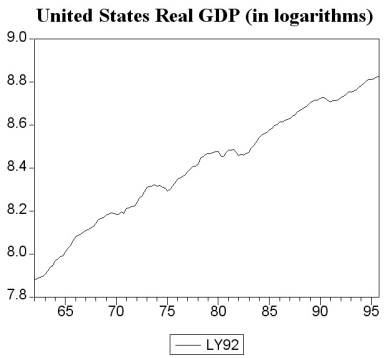
The following two graphs give you a plot of the United States aggregate unemployment rate for the sample period 1962:I to 1999:IV,and the (log)level of real United States GDP for the sample period 1962:I to 1995:IV.You want test for stationarity in both cases.Indicate whether or not you should include a time trend in your Augmented Dickey-Fuller test and why. 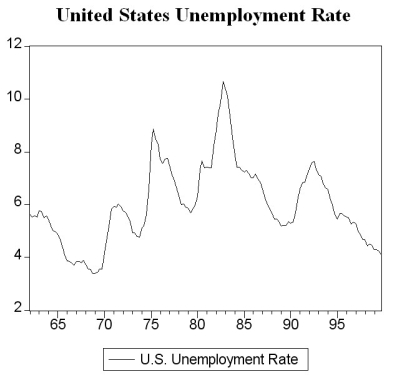
Definitions:
Andrew Carnegie
A 19th-century industrialist and philanthropist known for his massive wealth derived from the steel industry and his significant contributions to education, libraries, and peace initiatives.
Philanthropy
The desire to promote the welfare of others, expressed especially by the generous donation of money to good causes.
Rich
Having a great amount of wealth or resources; possessing more than enough material goods or money.
Benefit Society
An organization that provides support and assistance, often in the form of insurance or financial aid, to its members.
Q10: In the panel regression analysis of beer
Q15: Think of the situation of rolling two
Q16: When the sample size n is large,the
Q20: Your textbook states that under certain restrictive
Q22: Assume that your population regression function is<br>Yi
Q24: You want to find the determinants of
Q29: The regression R2 is a measure of<br>A)whether
Q75: It is estimated that 780,000 surgical site
Q92: The following table provides the results of
Q120: Because statistical software plays such an important