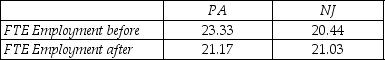
Let the vertical axis of a figure indicate the average employment fast food restaurants.There are two time periods,t = 1 and t = 2,where time period is measured on the horizontal axis.The following table presents average employment levels per restaurant for New Jersey (the treatment group)and Eastern Pennsylvania (the control group).
 Enter the four points in the figure and label them
  ,
,  ,
,  ,and
,and  .Connect the points.Finally calculate and indicate the value for
  .
.
Definitions:
Proportion
A segment, piece, or amount looked at in relation to the entirety.
Acid-test Ratio
A financial metric that measures a company's ability to pay off its current liabilities with its quick assets, providing insight into its short-term liquidity without relying on inventory assets.
Current Liabilities
Short-term financial obligations that are due within one year or within the normal operating cycle of the business, whichever is longer.
Inventory
Inventory consists of goods and materials a business holds for the ultimate purpose of sale, production, or utilization.
Q10: If the three least squares assumptions hold,then
Q15: Roughly ten percent of elementary schools in
Q16: When there is a single instrument and
Q22: Two Stage Least Squares is calculated as
Q25: Assume that for the T = 2
Q29: Problems caused by stochastic trends include all
Q31: Having more relevant instruments<br>A)is a problem because
Q57: A study was to be undertaken to
Q61: A 99% confidence interval is wider than
Q78: The chi-square test can compare more than