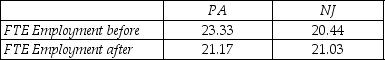
Let the vertical axis of a figure indicate the average employment fast food restaurants.There are two time periods,t = 1 and t = 2,where time period is measured on the horizontal axis.The following table presents average employment levels per restaurant for New Jersey (the treatment group)and Eastern Pennsylvania (the control group).
 Enter the four points in the figure and label them
  ,
,  ,
,  ,and
,and  .Connect the points.Finally calculate and indicate the value for
  .
.
Definitions:
Self-confidence
The belief in one's own abilities and judgment, often leading to a sense of competence and assertiveness.
Self-perception
The process by which an individual understands and interprets their own personality, behaviors, and characteristics, often shaped by social interactions and experiences.
Psychoanalytic Theory
A theory of socialization positing that the unconscious mind shapes human behavior.
Unconscious Mind
Part of the mind that is inaccessible to the conscious mind but that affects behavior and emotions.
Q8: The heteroskedasticity-robust estimator of <img src="https://d2lvgg3v3hfg70.cloudfront.net/TB2833/.jpg" alt="The
Q9: The distinction between endogenous and exogenous variables
Q10: An inspector inspects large truckloads of potatoes
Q18: Write down,in general,the variance-covariance matrix for the
Q21: Your packaging company fills various types of
Q31: A manufacturer receives parts from two suppliers.A
Q32: It has been argued that Canada's aggregate
Q70: When there are ∞ degrees of freedom,the
Q72: There have been many studies that looked
Q75: You are interested in determining if the