To analyze the year-to-year variation in temperature data for a given city,you regress the daily high temperature (Temp)for 100 randomly selected days in two consecutive years (1997 and 1998)for Phoenix.The results are (heteroskedastic-robust standard errors in parenthesis):  = 15.63 + 0.80 ×
  ;R2= 0.65,SER = 9.63
(0.10)
(a)Calculate the predicted temperature for the current year if the temperature in the previous year was 40°F,78°F,and 100°F.How does this compare with you prior expectation? Sketch the regression line and compare it to the 45 degree line.What are the implications?
(b)You recall having studied errors-in-variables before.Although the web site you received your data from seems quite reliable in measuring data accurately,what if the temperature contained measurement error in the following sense: for any given day,say January 28,there is a true underlying seasonal temperature (X),but each year there are different temporary weather patterns (v,w)which result in a temperature  different from X.For the two years in your data set,the situation can be described as follows:
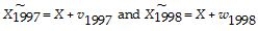
 Hence the population parameter for the intercept and slope are zero and one,as expected.It is not difficult to show that the OLS estimator for the slope is inconsistent,where
 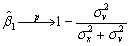 As a result you consider estimating the slope and intercept by TSLS.You think about an instrument and consider the temperature one month ahead of the observation in the previous year.Discuss instrument validity for this case.
(c)The TSLS estimation result is as follows:  = -6.24 + 1.07×
  ;
;
(0.06)
Perform a t-test on whether or not the slope is now significantly different from one.
Definitions:
HR Supply Analysis
A process used by organizations to assess the current capabilities and future availability of their workforce to meet business requirements.
Vacancy Model
A theoretical framework used to describe the dynamics of job vacancies within a labor market, including rates of job creation and job filling.
Mass Customizing
A manufacturing and marketing technique that combines the flexibility of personalization with the low unit costs associated with mass production.
Employment Experience
The cumulative knowledge, skills, and understanding that an individual gains through participating in the workforce.
Q15: The first difference of the logarithm of
Q21: Randomization based on covariates is<br>A)not of practical
Q21: Suppose that <img src="https://d2lvgg3v3hfg70.cloudfront.net/TB5065/.jpg" alt="Suppose that
Q30: Using the fact that the standardized variable
Q31: In the distributed lag model,the dynamic causal
Q32: A type I error is<br>A)always the same
Q37: Because statistical software plays such an important
Q47: You should use the QLR test for
Q93: The hypotheses H<sub>0</sub>: <font face="symbol"></font> = 350
Q113: Because statistical software plays such an important