The Report of the Presidential Commission on the Space Shuttle Challenger Accident in 1986 shows a plot of the calculated joint temperature in Fahrenheit and the number of O-rings that had some thermal distress.You collect the data for the seven flights for which thermal distress was identified before the fatal flight and produce the accompanying plot. 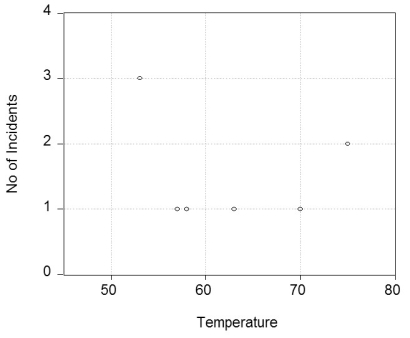 (a)Do you see any relationship between the temperature and the number of O-ring failures? If you fitted a linear regression line through these seven observations,do you think the slope would be positive or negative? Significantly different from zero? Do you see any problems other than the sample size in your procedure?
(b)You decide to look at all successful launches before Challenger,even those for which there were no incidents.Furthermore you simplify the problem by specifying a binary variable,which takes on the value one if there was some O-ring failure and is zero otherwise.You then fit a linear probability model with the following result,  = 2.858 - 0.037 × Temperature;R2 = 0.325,SER = 0.390,
(0.496)(0.007)
where Ofail is the binary variable which is one for launches where O-rings showed some thermal distress,and Temperature is measured in degrees of Fahrenheit.The numbers in parentheses are heteroskedasticity-robust standard errors.
Interpret the equation.Why do you think that heteroskedasticity-robust standard errors were used? What is your prediction for some O-ring thermal distress when the temperature is 31°,the temperature on January 28,1986? Above which temperature do you predict values of less than zero? Below which temperature do you predict values of greater than one?
(c)To fix the problem encountered in (b),you re-estimate the relationship using a logit regression:
Pr(OFail = 1  Temperature)= F (15.297 - 0.236 × Temperature);pseudo- R2=0.297
(7.329)(0.107)
What is the meaning of the slope coefficient? Calculate the effect of a decrease in temperature from 80° to 70°,and from 60° to 50°.Why is the change in probability not constant? How does this compare to the linear probability model?
(d)You want to see how sensitive the results are to using the logit,rather than the probit estimation method.The probit regression is as follows:
Pr(OFail = 1  Temperature)= Φ(8.900 - 0.137 × Temperature);pseudo- R2=0.296
(3.983)(0.058)
Why is the slope coefficient in the probit so different from the logit coefficient? Calculate the effect of a decrease in temperature from 80° to 70°,and from 60° to 50° and compare the resulting changes in probability to your results in (c).What is the meaning of the pseudo- R2? What other measures of fit might you want to consider?
(e)Calculate the predicted probability for 80° and 40°,using your probit and logit estimates.Based on the relationship between the probabilities,sketch what the general relationship between the logit and probit regressions is.Does there seem to be much of a difference for values other than these extreme values?
(f)You decide to run one more regression,where the dependent variable is the actual number of incidences (NoOFail).You allow for a different functional form by choosing the inverse of the temperature,and estimate the regression by OLS.  = -3.8853 + 295.545 × (1/Temperature);R2 = 0.386,SER = 0.622
(1.516)(106.541)
What is your prediction for O-ring failures for the 31° temperature which was forecasted for the launch on January 28,1986? Sketch the fitted line of the regression above.
Definitions:
Rung
A level or step in a ladder logic diagram or PLC programming, representing a basic control element or condition.
Bit Level Instructions
Operations that manipulate individual bits within a byte or word in computer programming or digital logic.
Addresses
In computing, addresses refer to specific locations in memory or storage where data is stored, allowing for precise access and manipulation of data by the system or the users.
CLX
Often relates to ControlLogix, a range of programmable logic controllers (PLCs) and systems designed by Rockwell Automation for industrial automation.
Q9: Pseudo out of sample forecasting can be
Q16: Consider the AR(1)model Yt = β0 +
Q17: Minimization of <img src="https://d2lvgg3v3hfg70.cloudfront.net/TB2833/.jpg" alt="Minimization of
Q26: When choosing between a one-sided alternative hypothesis
Q42: Multiperiod forecasting with multiple predictors<br>A)is the same
Q53: Because statistical software plays such an important
Q64: It is estimated that 780,000 surgical site
Q65: Suppose a study was done to determine
Q69: A particular paperback mystery book is published
Q83: The margin of error in a confidence