The logit regression (11.10)on page 393 of your textbook reads:  = F(-4.13 + 5.37 P/Iratio + 1.27 black)
(a)Using a spreadsheet program such as Excel,plot the following logistic regression function with a single X,  i =
i = 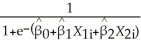 where
where  0 = -4.13,
  1 = 5.37,
  2 = 1.27.Enter values for X1 in the first column starting from 0 and then increment these by 0.1 until you reach 2.0.Let X2 be 0 at first.Then enter the logistic function formula in the next column.Next allow X2 to be 1 and calculate the new values for the logistic function in the third column.Finally produce the predicted probabilities for both blacks and whites,connecting the predicted values with a line.
(b)Using the same spreadsheet calculations,list how the probability increases for blacks and for whites as the P/I ratio increases from 0.5 to 0.6.
(c)What is the difference in the rejection probability between blacks and whites for a P/I ratio of 0.5 and for 0.9? Why is the difference smaller for the higher value here?
(d)Table 11.2 on page 401 of your textbook lists logit regressions (column 2)with further explanatory variables.Given that you can only produce simple plots in two dimensions,how would you proceed in (a)above if there were more than a single explanatory variable?
Definitions:
Price
The total money needed for acquiring a good, service, or asset.
Short Run
A period during which at least one of a firm's inputs is fixed, limiting its capacity to adjust to changes in demand.
TC
Total Costs, the sum of all costs incurred in the production of goods or services.
TR
Total Revenue; the total receipts from sales of goods or services provided by a company before any deductions are made.
Q6: A nationally distributed college newspaper conducts a
Q13: You have collected quarterly data for the
Q20: To test the null hypothesis of a
Q24: You want to find the determinants of
Q34: In the context of a controlled experiment,consider
Q45: A researcher investigating the determinants of crime
Q46: The concepts of exogeneity,strict exogeneity,and predeterminedness<br>A)are defined
Q50: Let Y be a random variable.Then var(Y)equals<br>A)
Q54: Hoping to attract more shoppers,a city builds
Q69: A particular paperback mystery book is published