Parts manufactured by an injection molding process are subjected to a compressive strength test.We wish to monitor the compressive strength of the parts manufactured by this process using both  and s charts.Samples of size 9 are to be taken at regular intervals,and their mean compressive strength (in psi = pounds per square inch) and standard deviation are plotted on the charts in time order.The target values for the compressive strengths are a mean of = 80 psi and a standard deviation of = 3 psi.The control chart constants are (partially) reproduced below.
 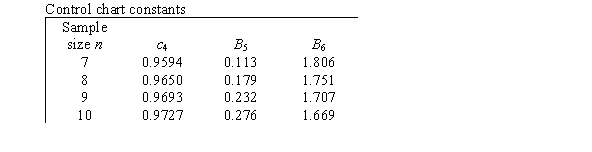 What is the lower control limit for the
Chart?
Definitions:
Mathematical Formula
A concise way of expressing information symbolically or a rule for calculating numerical values based on certain mathematical operations.
Standard Deviation
A measure of the amount of variation or dispersion of a set of values; a high standard deviation indicates greater variability.
Standard Normal Distribution
A normal distribution with a mean of 0 and a standard deviation of 1, used in z-score calculations to determine probabilities.
Normal Distribution
A statistical distribution which is evenly spread around the mean, indicating that occurrences close to the mean are more common than those further away.
Q3: If you draw an M&M candy at
Q6: The number of undergraduates at Johns Hopkins
Q8: In logistic regression,there can be _ explanatory
Q14: When performing a t procedure,it is best
Q20: In this experiment,the risk-taking propensity of 90
Q30: When we state the alternative hypothesis to
Q33: A study was done to determine whether
Q39: Thirty random students are selected and asked
Q46: The scores of individual students on the
Q77: Data were obtained in a study of