The Q-Q plot below shows the bootstrap distribution of a trimmed mean with a small bias and a large original sample.What method should be used to generate a 95% bootstrap confidence interval? 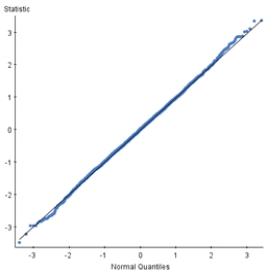
Definitions:
Data
Information collected for reference or analysis, often numeric, which can be used in making decisions or discussing facts.
Scores
Quantitative data or values that represent an individual's performance on assessments or tests.
Standard Deviation
A mathematical metric that determines the extent of variability or scatter among data points.
Mean
A numeric value that signifies the mean of a dataset, obtained by summing all the numbers in the set and then dividing by the count of the numbers.
Q9: A private university is trying to determine
Q17: Let X represent the SAT total score
Q22: Under what circumstances will the process capability
Q24: Which of the following statements is TRUE
Q29: At a large automobile factory,four different machines
Q40: Campus crime rates are generally lower than
Q42: An agricultural researcher plants 25 plots with
Q46: During the early part of the 1994
Q51: A study,conducted by Jackson et al.and published
Q72: The data referred to in this question