Independent random samples of households in the four U.S.regions (Northeast,Midwest,South,and West)yielded data on last year's energy consumption.We are interested in assessing,at the 1% significance level,if the data provide sufficient evidence to conclude that last year's average energy consumption was different among the four U.S.regions.Assume that energy consumption in the four regions is Normally distributed.
SPSS was used to create the side-by-side boxplots shown below. 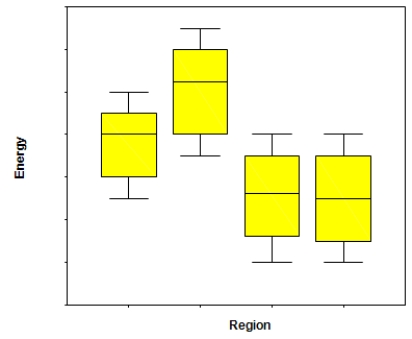 What assumption needed for an ANOVA F test can be checked with this graph?
Definitions:
Party Identification
The political party with which an individual identifies, often influencing their voting behavior and political opinions.
White Southerners
A demographic group in the United States, historically associated with the southern states.
Political Parties
Organizations that seek to achieve political power by electing their members to public office.
Strength And Importance
Terms reflecting the power, effectiveness, and significance of something or someone in a given context.
Q17: Wild horse populations on federal lands have
Q21: In the National Football League (NFL),having an
Q35: Piston rings for an automotive engine are
Q39: We have a data set where the
Q39: The following scatter plot and SPSS output
Q45: In the United States the month of
Q64: A study on color brightness for different
Q69: The following stemplot displays the number of
Q78: The data referred to in this question
Q78: Strict behaviorists avoid the word reward,in favor