As in most professional sports,statistics are collected in the National Hockey League.In the 2006-2007 season,teams played 82 games.A team was awarded 2 points for a win and 1 point if the game was tied at the end of regulation time but then lost in overtime.For each of the 30 teams,data on the number of goals scored per game (Goals/G) and the percentage of the 164 possible points they won (Win%) during the season were collected.The following graph shows the plotted points for the variables Win% and Goals/G and the simple linear regression line fitted using least squares. 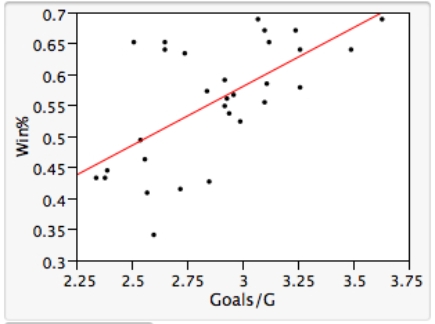 From the computer output for the least-squares fit,the estimated equation was found to be
  ,
,  = 0.398,and
  = 60.29.Also,it was determined from the output that
  = 12.800 and
  = 4.418.What would the approximate 96% confidence interval be for the true slope
  ?
?
Definitions:
Return On Assets
A financial ratio indicating the profitability of a company relative to its total assets, measuring efficiency in generating earnings.
Ratio Form
A mathematical expression that represents the relationship between two numbers or variables as a fraction.
Average Total Assets
A financial metric that represents the average value of all a company's assets over a specified period.
Return On Assets
This ratio indicates how efficiently a company uses its assets to generate profit, calculated as net income divided by total assets.
Q16: A multiple linear regression model can be
Q19: In this experiment,the risk-taking propensity of 90
Q29: A research project studied the physical properties
Q39: Malaria is a leading cause of infectious
Q43: The statistical model for linear regression can
Q59: At the start of the semester,a professor
Q61: There is an old saying in golf:
Q124: Consider the following data which describe the
Q126: Which of the following is true about
Q130: Give an example of classical conditioning.Be sure