A graphical representation of a linear program is shown below. The shaded area represents the feasible region, and the dashed line in the middle is the slope of the objective function. 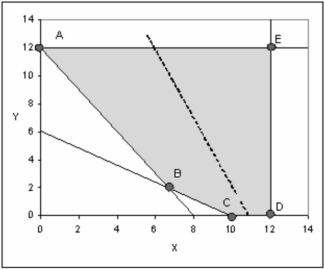
What would the be the new slope of the objective function if multiple optimal solutions occurred along line segment AB?
Definitions:
Deductive Reasoning
A logical process where a conclusion follows necessarily from the stated premises, moving from general premises to a specific conclusion.
Intuitive Thought
A cognitive process that occurs without deliberate analytical effort, often based on quick, gut feelings or experiences.
Concrete Reasoning
The ability to understand and reason about things that are directly experienced or seen, focusing on the literal and present aspects.
Intuitive Thought
The process of knowing or understanding something instinctively, without the need for conscious reasoning.
Q24: In a transportation problem, items are allocated
Q40: A key element of a decision support
Q46: In a balanced transportation model, supply equals
Q50: A system has one service facility that
Q56: When no historical sales data is available,
Q65: Computer simulation is a useful tool because
Q76: Product mix problems cannot have greater-than-or-equal-to (≥)
Q76: If the optimal solution includes x11 =
Q98: Determine the minimum distance required to connect
Q116: Without satisfying the non-negativity constraint, a solution