The figure below shows the nodes (A-I) and capacities (labelled on arcs in TB/s) of a computer network. The firm would like to know how much information can flow from node A to node I. 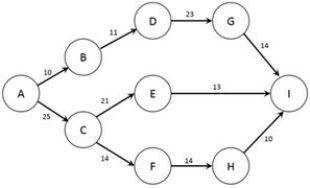 Note: This question requires Solver.
Formulate the problem in Solver and find the optimal solution. At maximum capacity, what will be the data flow between nodes F and H?
Definitions:
Inventory Period
The average time it takes for a company's inventory to be sold and replaced.
Cash Cycle
The duration of time it takes for a company to convert its investments in inventory and other resources into cash flows from sales.
Credit Sales
Transactions where goods or services are sold by a company with payment to be received at a later date.
Operating Cycle
The duration between a company's purchase of inventory and the receipt of cash from accounts receivable.
Q2: Note: This problem requires the use
Q15: The reality elements in media messages<br>A) are
Q20: The figure below shows the possible routes
Q22: Graphical analysis can only be used in
Q32: A event node in a decision tree
Q44: The production planner for a private label
Q53: Mutation is the technique used to create
Q57: <img src="https://d2lvgg3v3hfg70.cloudfront.net/TB6598/.jpg" alt=" Where is the
Q57: In order to generate more accurate results
Q58: A firm has 4 plants that