Life Expectancy Narrative
An actuary wanted to develop a model to predict how long individuals will live. After consulting a number of physicians, she collected the age at death (y), the average number of hours of exercise per week (  ), the cholesterol level (
  ), and the number of points that the individual's blood pressure exceeded the recommended value (
  ). A random sample of 40 individuals was selected. The computer output of the multiple regression model is shown below.
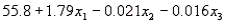
The regression equation is 
 S = 9.47 R-Sq = 22.5%
Analysis of Variance 
-Refer to Life Expectancy Narrative. What is the coefficient of determination? What does this statistic tell you?
Definitions:
Q30: Refer to Life Expectancy Narrative. Is there
Q34: The degrees of freedom associated with a
Q61: Refer to Product Markup Narrative. Find a
Q66: In a goodness-of-fit test, suppose that the
Q69: Refer to Randomized Block Design Narrative. Do
Q86: In a regression setting, you should select
Q90: In the simple linear regression model, what
Q118: Refer to College Textbook Sales Narrative. What
Q130: In a normal approximation to the sign
Q141: An adjusted coefficient of multiple determination, denoted