Demographic Variables and TV Narrative
A statistician wanted to determine if the demographic variables of age, education, and income influence the number of hours of television watched per week. A random sample of 25 adults was selected to estimate the multiple regression model:  , where y is the number of hours of television watched last week,
  is the age (in years),
  is the number of years of education, and
  is income (in $1000s). The computer output is shown below.
The regression equation is 
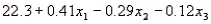
 S = 4.51 R-Sq = 34.8%
Analysis of Variance 
-Refer to Demographic Variables and TV Narrative. Interpret the coefficient  .
.
Definitions:
Alternative Behavior Patterns
Behaviors that are adopted as substitutes for other actions that may be undesirable or harmful, often used in the context of therapy or behavior modification.
Evidence-based Practices
Techniques or interventions that have been scientifically tested and proven to produce desired outcomes.
Intervention Approaches
Strategies or methods used to address and manage problem behavior or to bring about positive change.
Clinical Social Workers
Professionals who provide therapy, counseling, and support services to individuals and families, addressing mental health and emotional issues.
Q4: In testing <img src="https://d2lvgg3v3hfg70.cloudfront.net/TB4962/.jpg" alt="In testing
Q24: The Wilcoxon rank sum test is used
Q33: In simple linear regression, most often we
Q37: Which of the following is the appropriate
Q76: If the coefficient of determination is 0.982,
Q77: The method of least-squares requires that the
Q95: Refer to Delivery Time Narrative. What is
Q158: A chi-square test of independence with 10
Q163: Refer to Extra Help Sessions Narrative. Use
Q218: Let <img src="https://d2lvgg3v3hfg70.cloudfront.net/TB4962/.jpg" alt="Let be